| a Bhabha Atomic Research Centre, Vizag, India;
| b University of Helsinki, Finland
You can start the audio slideshow from the player controls at the bottom or read the notes along with slides by pressing the 's' key.
Who am I?
I am a researcher at the Bhabha Atomic Research Centre, Vizag, India
My masters was in Computer Science and Engg. with specialisation in Nuclear Engg.
I currently work on applying computational and ML techniques to computational physics problems
You can check my other github repositories to know more about my work which ranges from
distributed computing to computer science educational tools:
EasyLambda: Distributed data processing with functional list operations & MPI
Eka: A new old take on learning and teaching programming
Pawn: Command line scripting for distributed data processing
A Collision Cascade
Clusters
IN CASCADES
Cluster Shapes Matter
Decide diffusion (sessile / glissile)
Capture and Recombination properties
Thermal stability
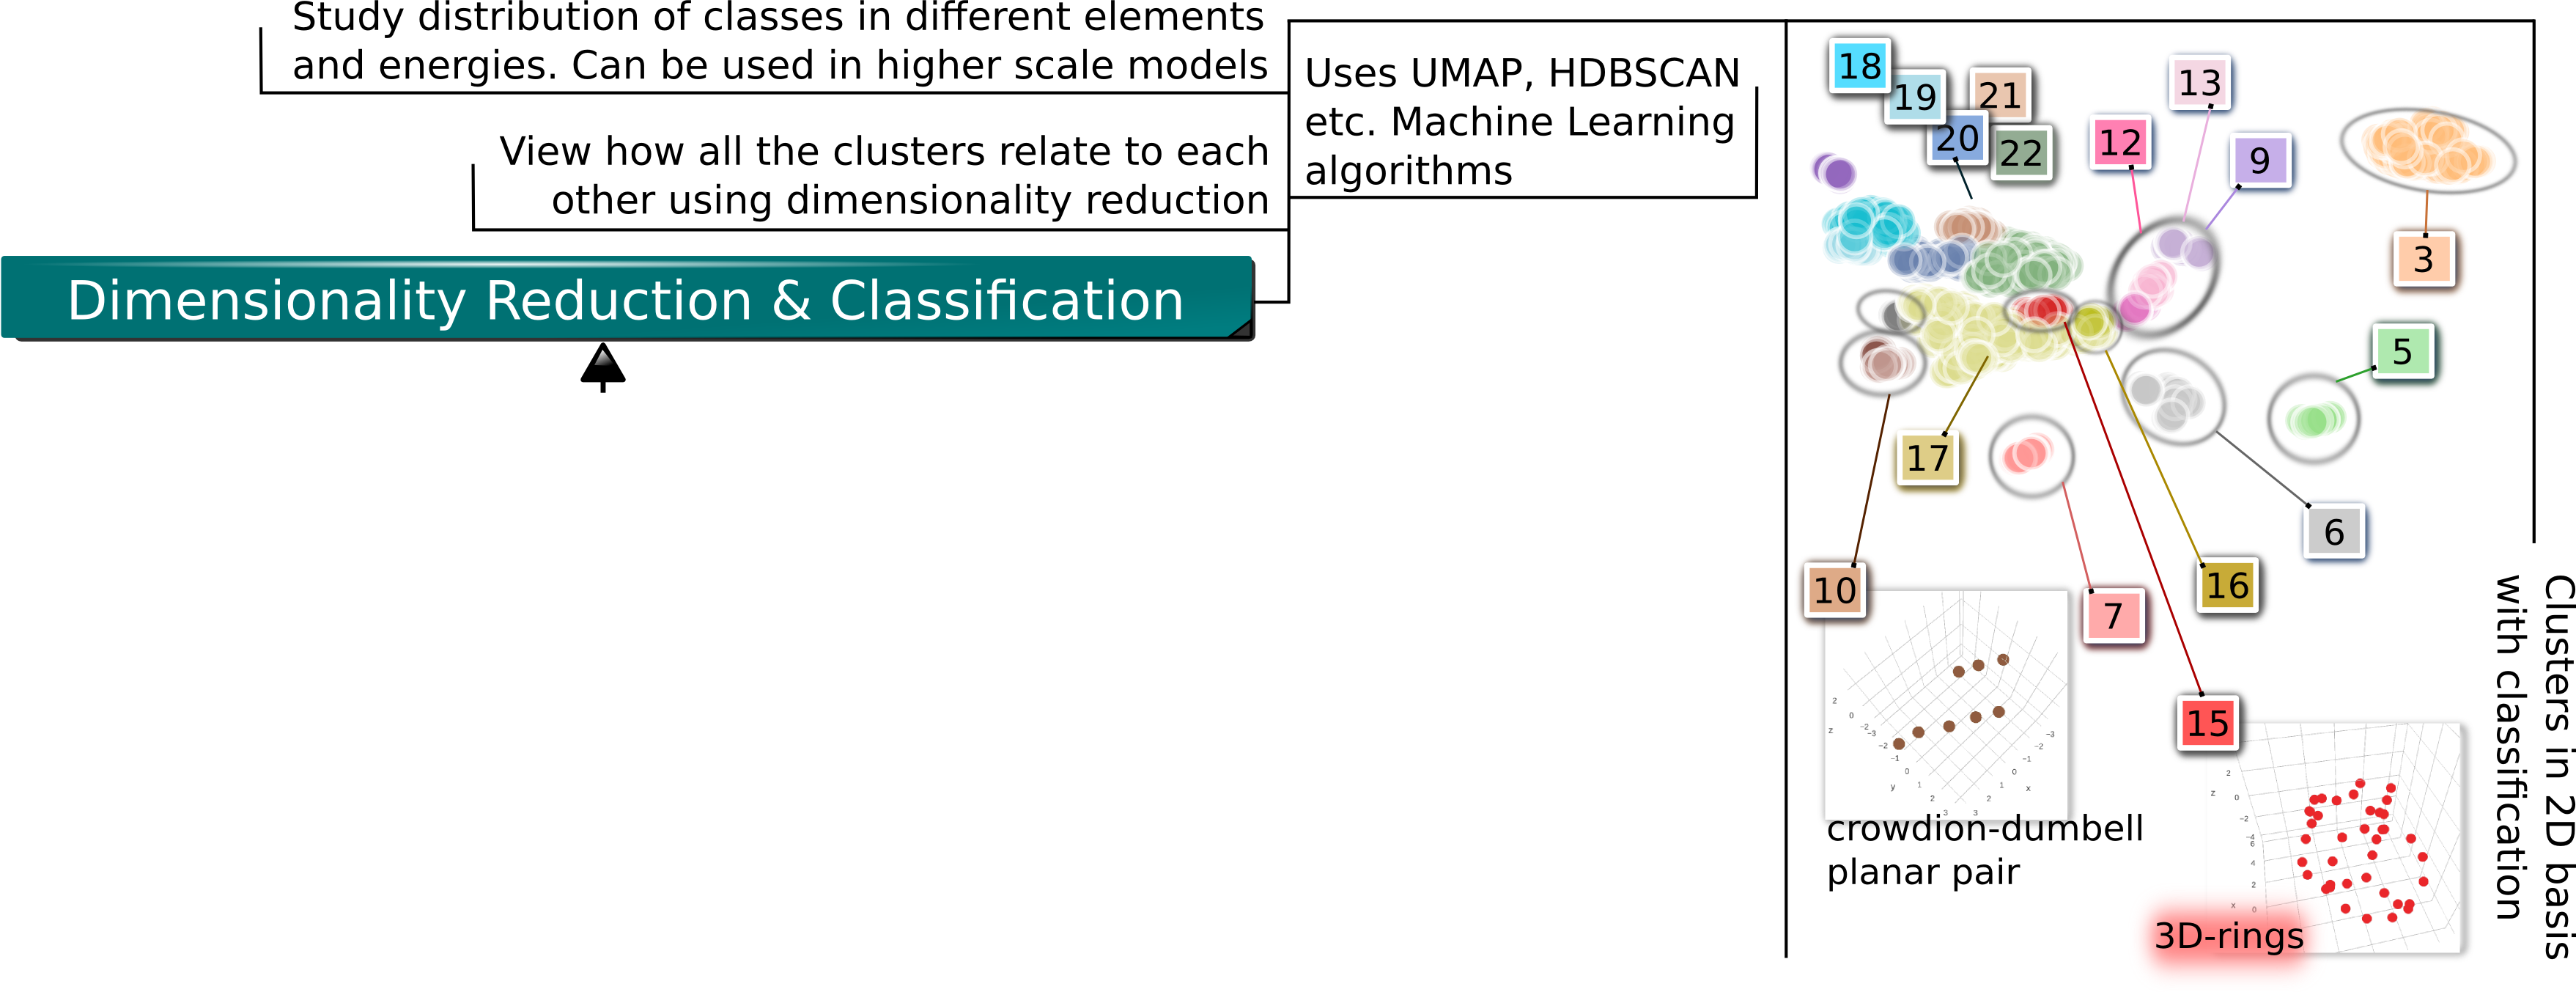
The higher scale models can use the distribution of different cluster classes along with their properties as inputs.
In terms of the development of models to describe the evolution of radiation
damage and its role in irradiation-induced changes in material properties,
the important parameters are not only the total number of Frenkel defects
per cascade but also the distribution of their population in clusters and
the form and mobility of these clusters.
Now that we can have big databases of collision cascades can we use
the data itself to systematically find different classes of
cluster defects and get insights into each of the classes. Can we do the following:
If we look at an interesting cluster in a cascade, can we ask which other cascades have
similar clusters and how do they look.
and can this query be fast for a big database of collision cascades & clusters.
Can we derive from data what all shapes are possible for different elements and energies
and how the different classes of shapes relate to each other.
Methods Overview
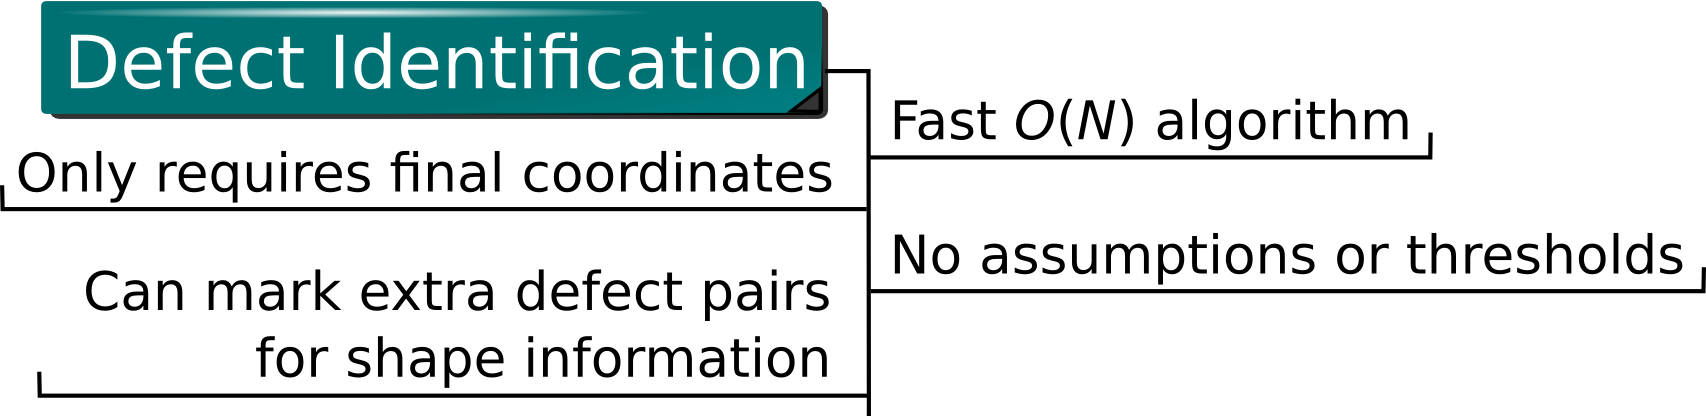
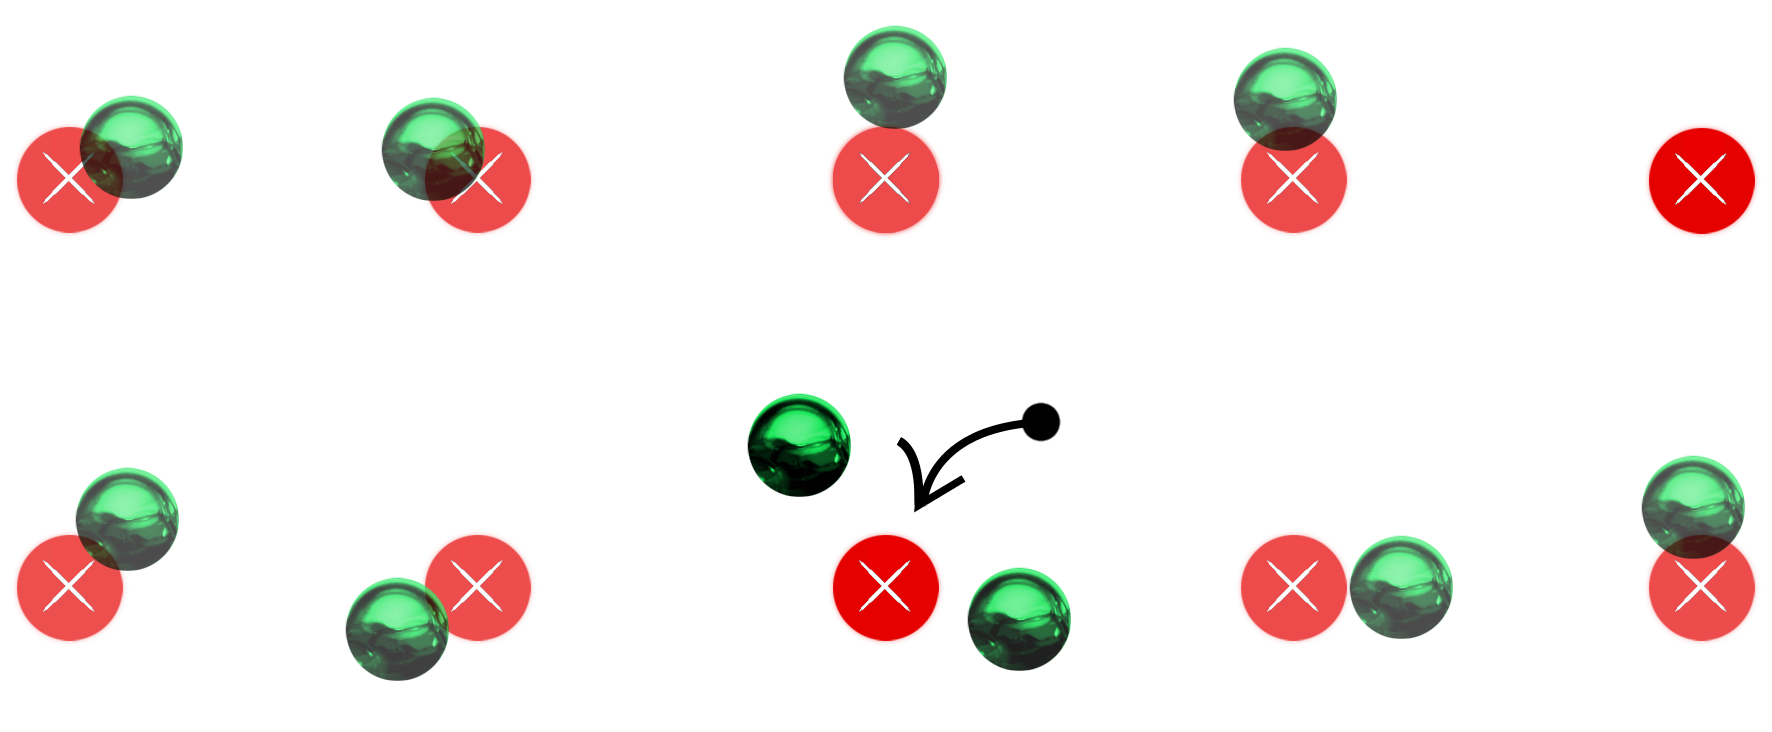
Defect Identification
Motivation / Goals
Find and mark psuedo defects
Only final coordinates as inputs: no assumptions or ambiguous inputs
Space efficient: Does not need to have whole initial lattice in the memory
Fast: Can be implemented as O(N), N being number of atoms
Simple implementation: no specialized datastructures like kd-trees used
http://arxiv.org/abs/1811.10923
Related alogrithms: Sphere threshold based methods and Wigner-Seitz.
Algorithm
Calculation of closest lattice site
Find Modulus of coordinates by lattice constant to find closest lattice site in the first unit cell.
Find cell in which an atom is present by finding ceiling of quotient when coordinates are divided by lattice constant.
Assign a number to each atom based on the ordering of lattice sites.
Enumeration
If an atom is associated with a lattice site that is already marked by another atom, label all the
associated atoms as interstitials and lattice site as vacancy. Also, label the vacancy and closest
interstitial to it among all associated ones as pseudo.
Label the lattice sites not associated with any atom as vacancy.
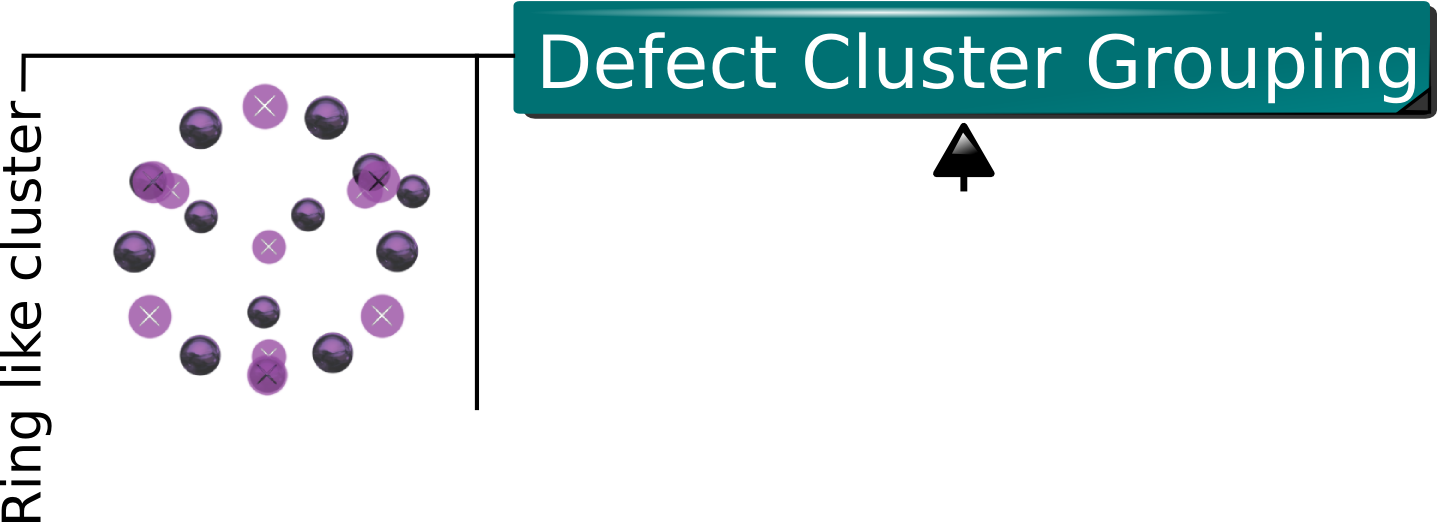
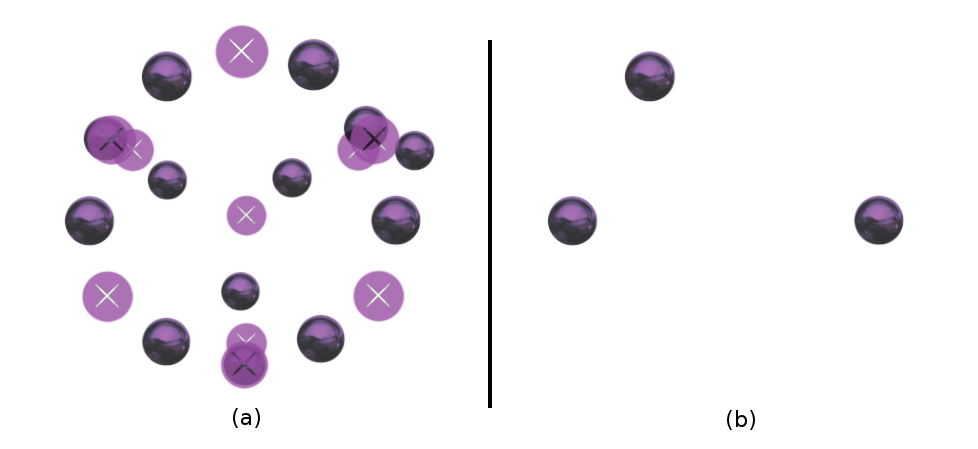
Grouping defects into Clusters
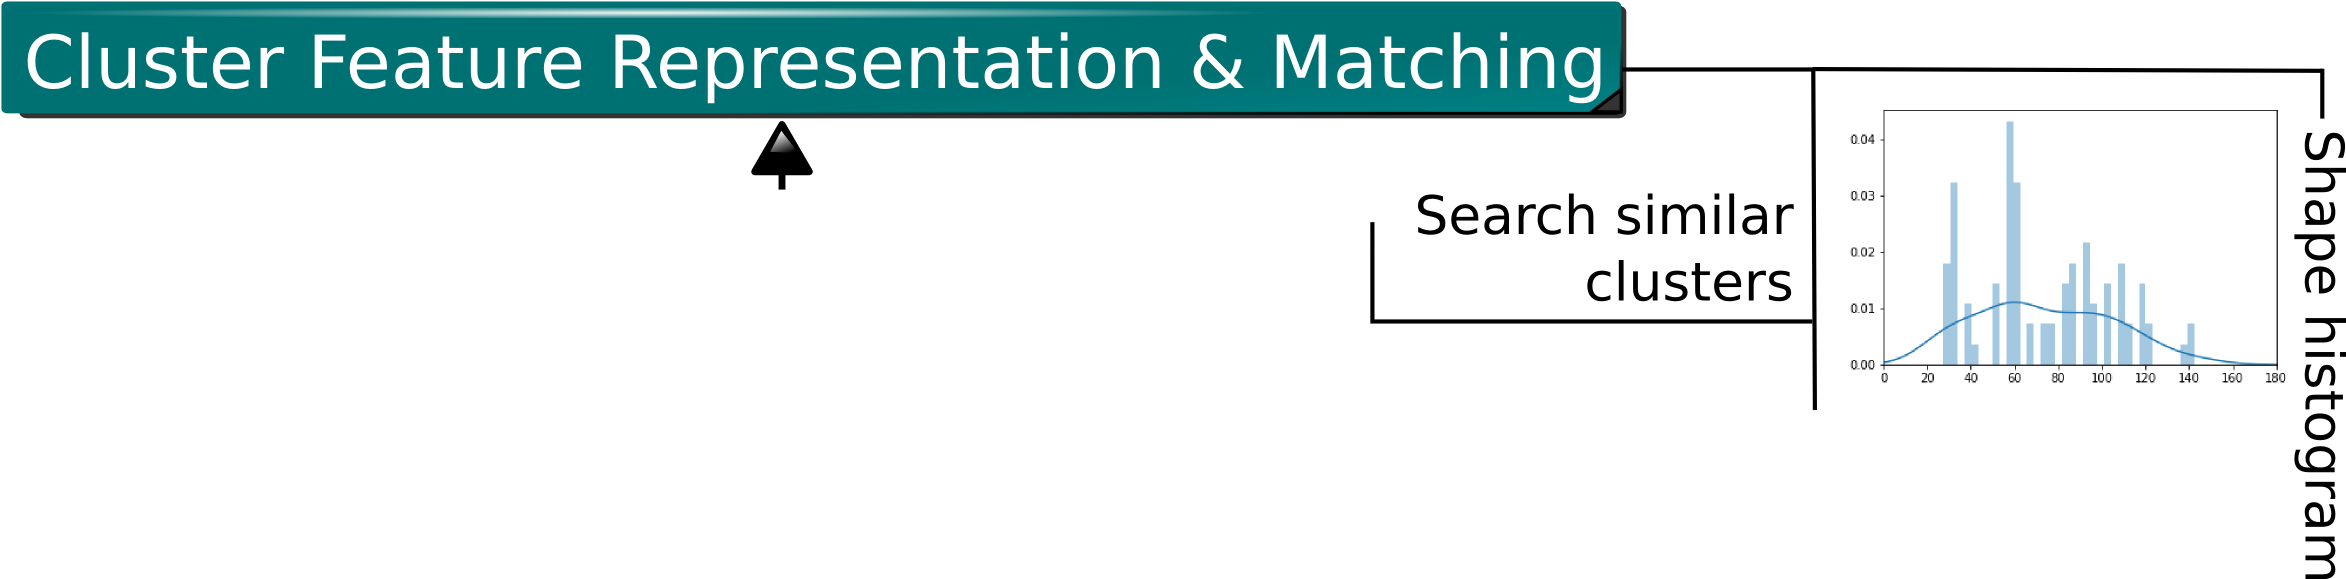
Feature Vector to Characterize Cluster Shapes
Motivation
Characterize cluster shapes in some qualitative sense
Local saliency but should include some sense of global shape
Gloss over small details, strong robustness to noise
Invariant to transformations (rotations, translations, scaling etc.)
Fast similarity search in a large database
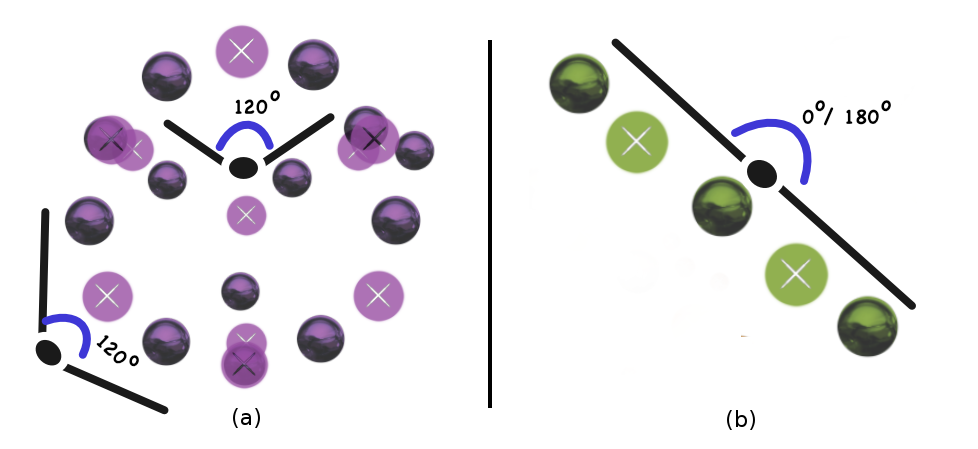
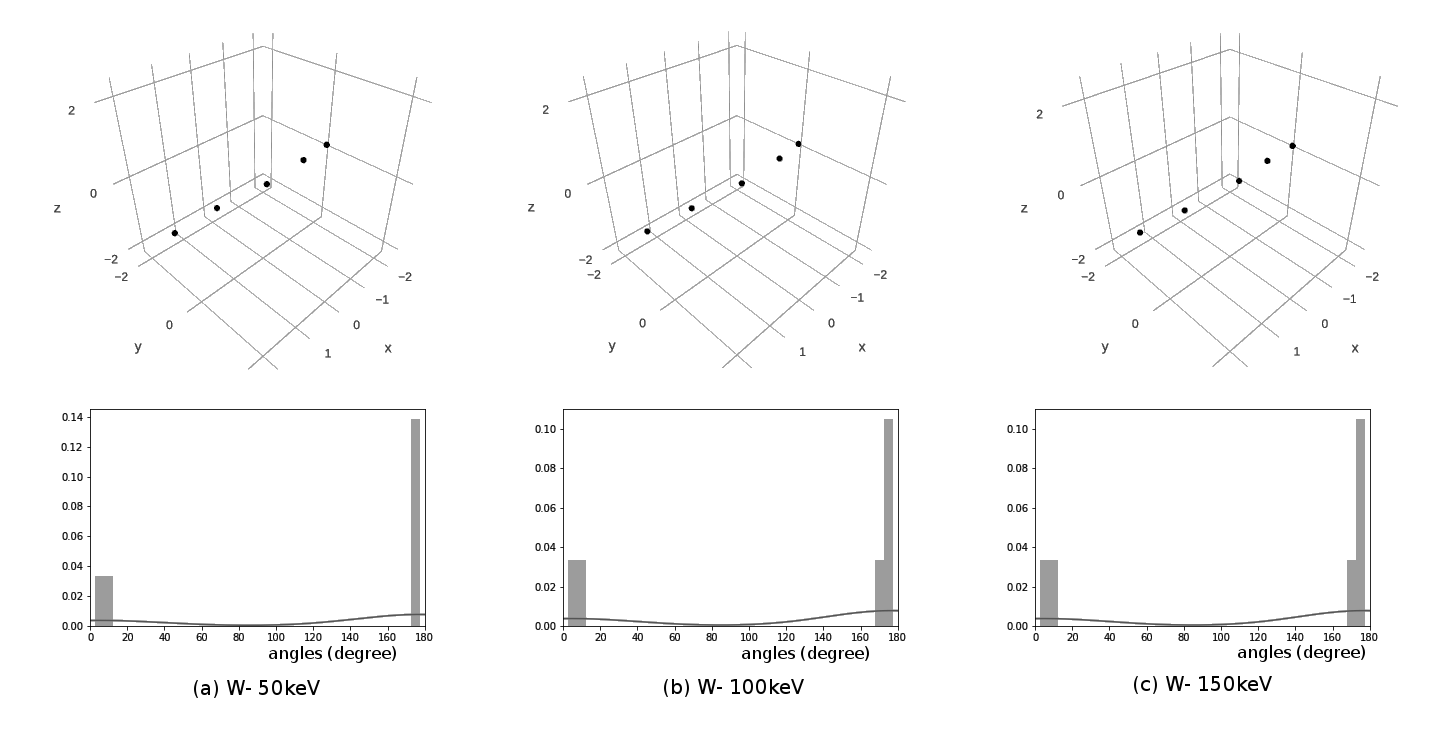
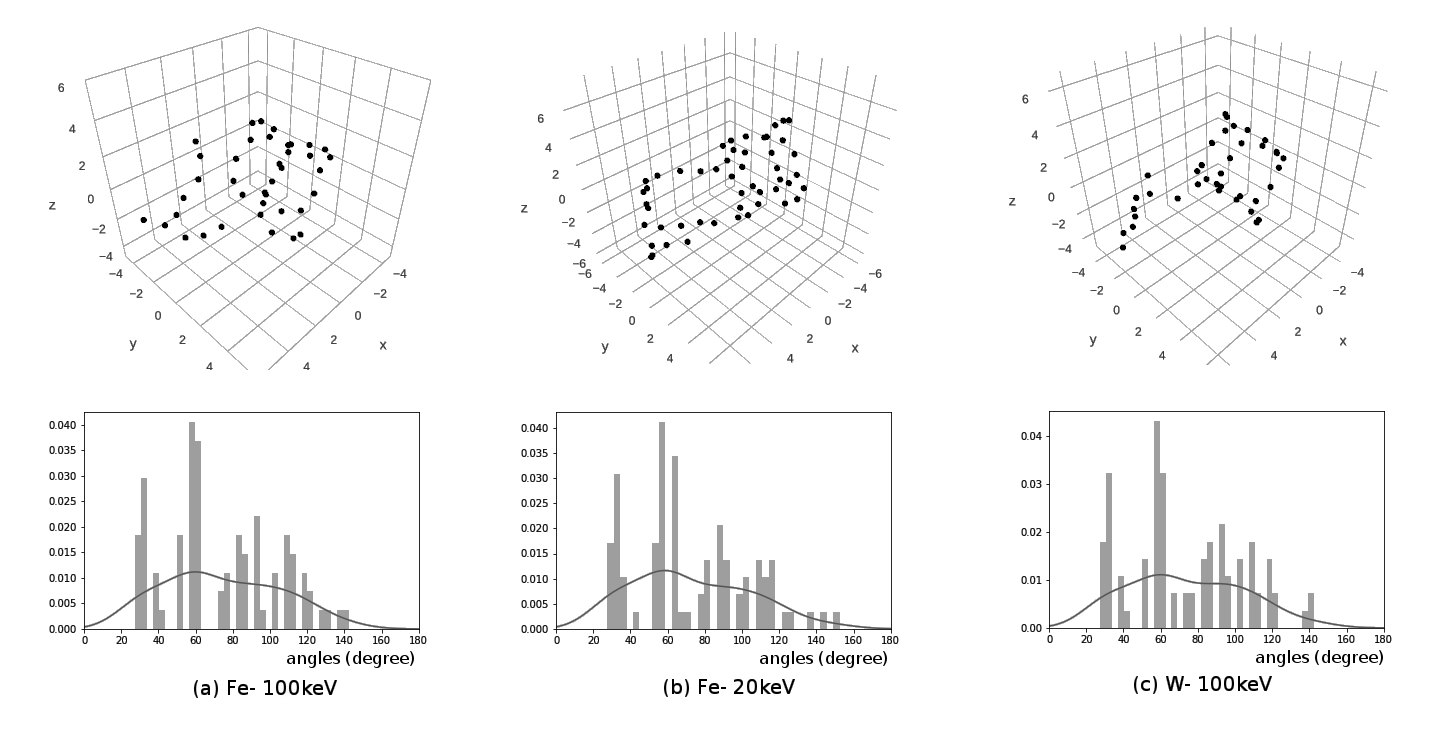
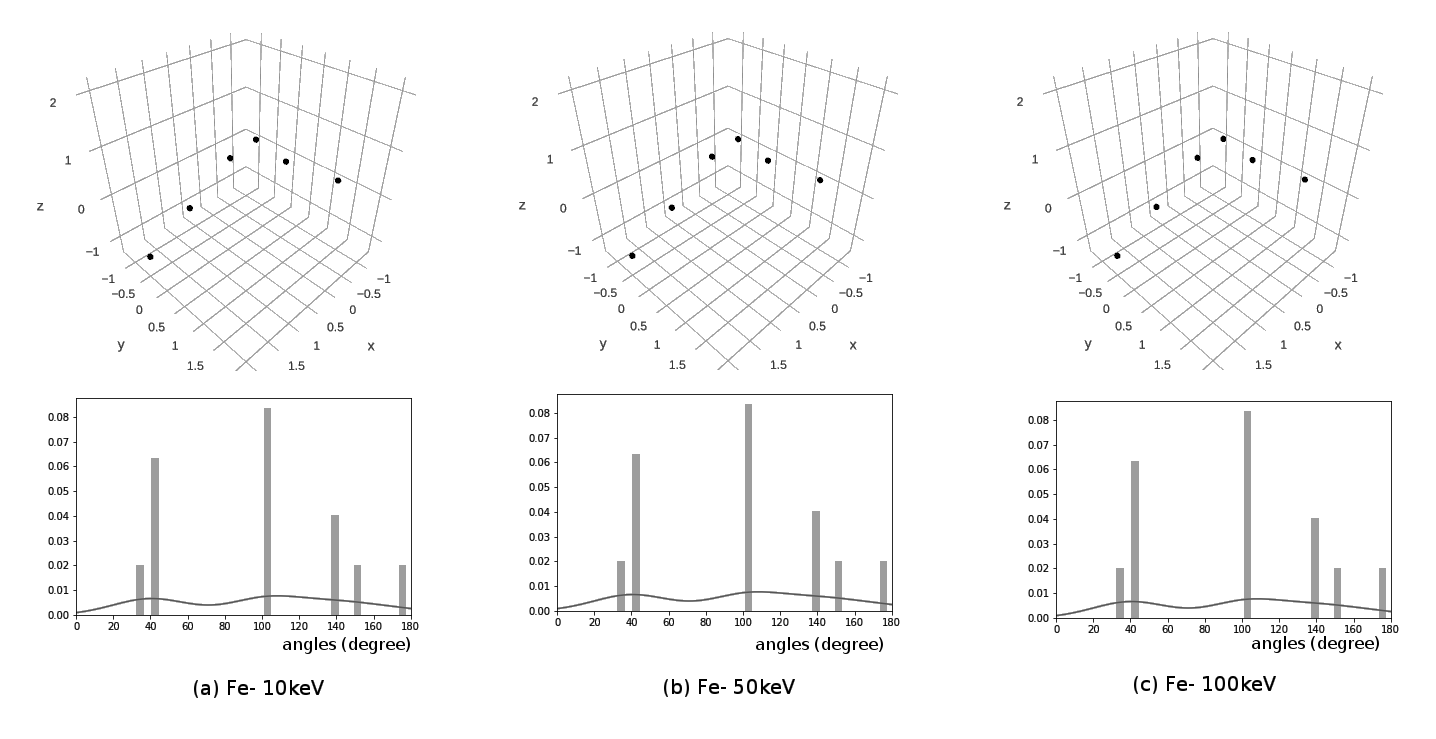
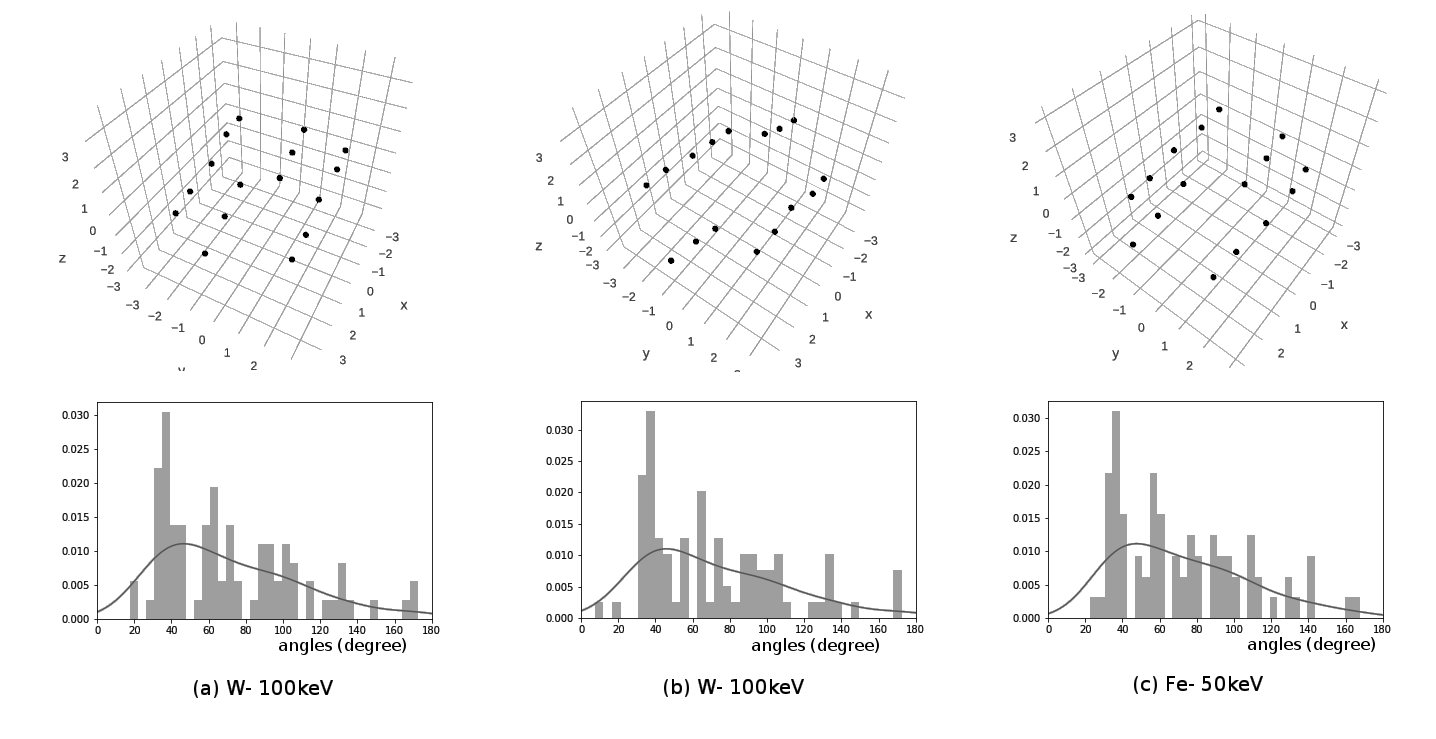
Motivation - Angles
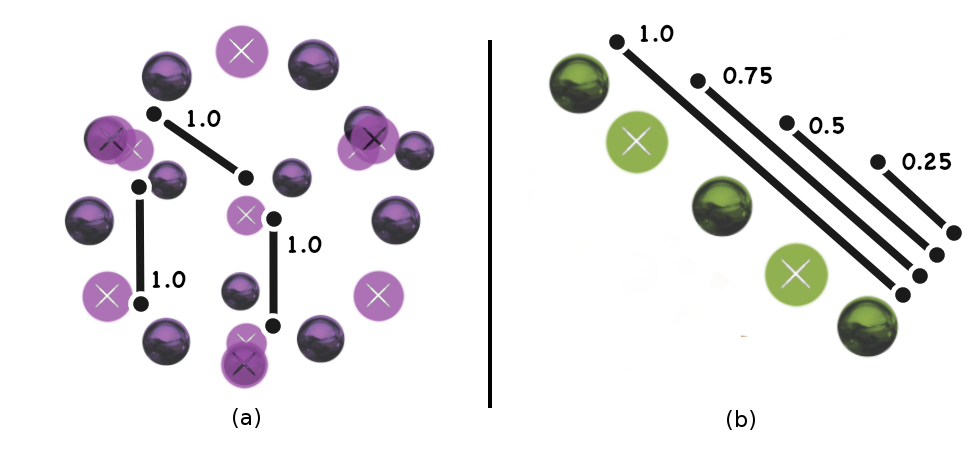
Motivation - Distances
Distance Measures
Euclidean
KL Divergence
Cosine
Quadratic Form Distance Functions
Some Typical Feature Vectors
Other Features
Shape distance measures
sensitive to noise, examples include Hausdorff distance, closest points search etc.
Shape Context method
global feature, comparison of complete shapes, sensitive to noise inherent in our data
Saliency features from point-cloud applications
targetted for large number of points specially surface points
Graph CNN, deep learning methods
require labelling, less points per cluster and less data can affect accuracy
Visualizing Similarities Between All The Clusters At Once
Using neighbour graph dimensionality reduction techniques like t-SNE and UMAP
Similarity based dimensionality reduction - TSNE
Classification
UMAP for dimensionality reduction
HDBSCAN for clustering
Properties of Classes
Sizes
Dimensionality
Distribution Across Elements & Energies
More Properties To Look At
Distribution across different angles of PKA launch
Dislocation loops, diffusion properties, stability etc.
Distribution across cascades with and without subcascades
Concluding Remarks
The classification gives a way to systematically study the zoo of defect clusters formed in primary
damage due to irradiation.
Since the classification is all automated, it can be applied to large databases of simulations of new
materials
The same approach, with possibly different feature vector, can be
extended to find structures and classes in subcascades and cascades themselves.
THE END
Download Csaransh and give
it a try on your data (https://github.com/haptork/csaransh/)
Discuss the results, get back with suggestions, feedback and code at github repository.
We are open for collaboration.